
Page 42 - 2025 HEG Daily Energy Market Report
P. 42
Monday, March 2, 2026
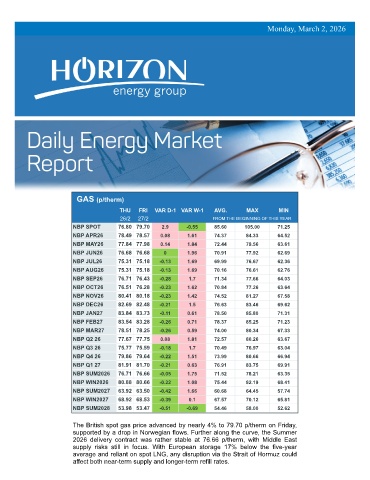
GAS (p/therm)
THU FRI VAR D-1 VAR W-1 AVG. MAX MIN
26/2 27/2 FROM THE BEGINNING OF THIS YEAR
NBP SPOT 76.80 79.70 2.9 -0.55 85.60 105.00 71.25
NBP APR26 78.49 78.57 0.08 1.61 74.37 84.33 64.52
NBP MAY26 77.84 77.98 0.14 1.84 72.44 79.56 63.61
NBP JUN26 76.68 76.68 0 1.96 70.91 77.92 62.69
NBP JUL26 75.31 75.18 -0.13 1.69 69.99 76.67 62.36
NBP AUG26 75.31 75.18 -0.13 1.69 70.16 76.61 62.76
NBP SEP26 76.71 76.43 -0.28 1.7 71.34 77.66 64.03
NBP OCT26 76.51 76.28 -0.23 1.62 70.84 77.26 63.64
NBP NOV26 80.41 80.18 -0.23 1.42 74.52 81.27 67.58
NBP DEC26 82.69 82.48 -0.21 1.5 76.63 83.46 69.62
NBP JAN27 83.84 83.73 -0.11 0.61 78.50 85.80 71.31
NBP FEB27 83.54 83.28 -0.26 0.71 78.37 85.25 71.23
NBP MAR27 78.51 78.25 -0.26 0.59 74.00 80.34 67.33
NBP Q2 26 77.67 77.75 0.08 1.81 72.57 80.26 63.67
NBP Q3 26 75.77 75.59 -0.18 1.7 70.49 76.97 63.04
NBP Q4 26 79.86 79.64 -0.22 1.51 73.99 80.66 66.94
NBP Q1 27 81.91 81.70 -0.21 0.63 76.91 83.75 69.91
NBP SUM2026 76.71 76.66 -0.05 1.75 71.52 78.21 63.35
NBP WIN2026 80.88 80.66 -0.22 1.08 75.44 82.19 68.41
NBP SUM2027 63.92 63.50 -0.42 1.66 60.68 64.45 57.74
NBP WIN2027 68.92 68.53 -0.39 0.1 67.57 70.12 65.81
NBP SUM2028 53.98 53.47 -0.51 -0.69 54.46 58.00 52.62
The British spot gas price advanced by nearly 4% to 79.70 p/therm on Friday,
supported by a drop in Norwegian flows. Further along the curve, the Summer
2026 delivery contract was rather stable at 76.66 p/therm, with Middle East
supply risks still in focus. With European storage 17% below the five-year
average and reliant on spot LNG, any disruption via the Strait of Hormuz could
affect both near-term supply and longer-term refill rates.