
Page 22 - 2025 HEG Daily Energy Market Report
P. 22
Monday, March 9, 2026
GAS (p/therm)
THU FRI VAR D-1 VAR W-1 AVG. MAX MIN
5/3 6/3 FROM THE BEGINNING OF THIS YEAR
NBP SPOT 128.00 133.25 5.25 53.55 90.16 137.00 71.25
NBP APR26 131.50 137.42 5.92 58.85 80.43 140.99 64.52
NBP MAY26 125.82 134.17 8.35 56.19 78.14 135.32 63.61
NBP JUN26 118.01 127.30 9.29 50.62 76.01 127.96 62.69
NBP JUL26 111.01 121.31 10.3 46.13 74.52 121.31 62.36
NBP AUG26 108.12 120.01 11.89 44.83 74.44 120.01 62.76
NBP SEP26 107.59 121.09 13.5 44.66 75.44 121.09 64.03
NBP OCT26 106.41 119.32 12.91 43.04 74.76 119.32 63.64
NBP NOV26 107.54 121.02 13.48 40.84 78.17 121.02 67.58
NBP DEC26 108.41 123.67 15.26 41.19 80.16 123.67 69.62
NBP JAN27 106.88 121.23 14.35 37.5 81.61 121.23 71.31
NBP FEB27 103.73 118.83 15.1 35.55 81.12 118.83 71.23
NBP MAR27 95.68 109.05 13.37 30.8 76.34 109.05 67.33
NBP Q2 26 125.12 132.98 7.86 55.23 78.19 134.76 63.67
NBP Q3 26 108.92 120.80 11.88 45.21 74.79 120.80 63.04
NBP Q4 26 107.45 121.34 13.89 41.7 77.69 121.34 66.94
NBP Q1 27 102.04 116.29 14.25 34.59 79.64 116.29 69.91
NBP SUM2026 116.98 126.86 9.88 50.2 76.48 126.91 63.35
NBP WIN2026 104.78 118.84 14.06 38.18 78.66 118.84 68.41
NBP SUM2027 73.90 81.17 7.27 17.67 62.06 81.17 57.74
NBP WIN2027 73.91 79.80 5.89 11.27 68.18 79.80 65.81
NBP SUM2028 55.02 56.22 1.2 2.75 54.48 58.00 52.62
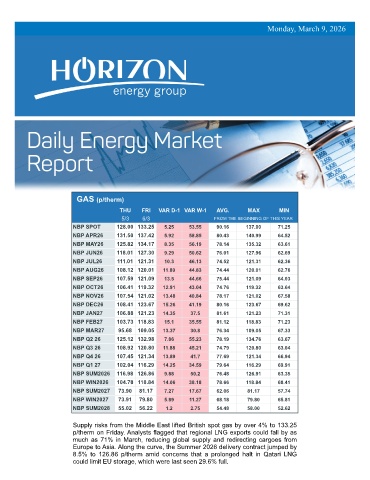
Supply risks from the Middle East lifted British spot gas by over 4% to 133.25
p/therm on Friday. Analysts flagged that regional LNG exports could fall by as
much as 71% in March, reducing global supply and redirecting cargoes from
Europe to Asia. Along the curve, the Summer 2026 delivery contract jumped by
8.5% to 126.86 p/therm amid concerns that a prolonged halt in Qatari LNG
could limit EU storage, which were last seen 29.6% full.