
Page 26 - 2025 HEG Daily Energy Market Report
P. 26
Friday, March 6, 2026
GAS (p/therm)
WED THU VAR D-1 VAR W-1 AVG. MAX MIN
4/3 5/3 FROM THE BEGINNING OF THIS YEAR
NBP SPOT 125.50 128.00 2.5 51.2 88.14 137.00 71.25
NBP APR26 126.88 131.50 4.62 53.01 79.16 140.99 64.52
NBP MAY26 120.27 125.82 5.55 47.98 76.89 135.32 63.61
NBP JUN26 112.31 118.01 5.7 41.33 74.87 127.96 62.69
NBP JUL26 105.52 111.01 5.49 35.7 73.48 121.11 62.36
NBP AUG26 103.06 108.12 5.06 32.81 73.43 119.13 62.76
NBP SEP26 102.81 107.59 4.78 30.88 74.42 117.12 64.03
NBP OCT26 100.01 106.41 6.4 29.9 73.77 115.32 63.64
NBP NOV26 101.10 107.54 6.44 27.13 77.22 115.82 67.58
NBP DEC26 102.01 108.41 6.4 25.72 79.20 115.42 69.62
NBP JAN27 100.21 106.88 6.67 23.04 80.73 110.77 71.31
NBP FEB27 96.95 103.73 6.78 20.19 80.28 104.55 71.23
NBP MAR27 89.85 95.68 5.83 17.17 75.62 96.03 67.33
NBP Q2 26 119.82 125.12 5.3 47.45 76.98 134.76 63.67
NBP Q3 26 103.81 108.92 5.11 33.15 73.77 119.14 63.04
NBP Q4 26 101.04 107.45 6.41 27.59 76.72 115.52 66.94
NBP Q1 27 95.63 102.04 6.41 20.13 78.83 103.76 69.91
NBP SUM2026 111.77 116.98 5.21 40.27 75.36 126.91 63.35
NBP WIN2026 98.36 104.78 6.42 23.9 77.76 109.70 68.41
NBP SUM2027 70.76 73.90 3.14 9.98 61.63 73.90 57.74
NBP WIN2027 71.59 73.91 2.32 4.99 67.92 73.91 65.81
NBP SUM2028 53.92 55.02 1.1 1.04 54.44 58.00 52.62
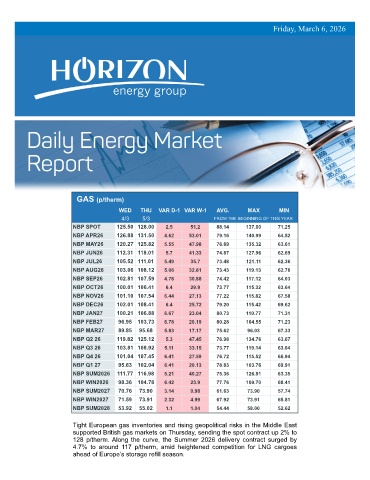
Tight European gas inventories and rising geopolitical risks in the Middle East
supported British gas markets on Thursday, sending the spot contract up 2% to
128 p/therm. Along the curve, the Summer 2026 delivery contract surged by
4.7% to around 117 p/therm, amid heightened competition for LNG cargoes
ahead of Europe’s storage refill season.