
Page 18 - 2025 HEG Daily Energy Market Report
P. 18
Tuesday, March 10, 2026
GAS (p/therm)
FRI MON VAR D-1 VAR W-1 AVG. MAX MIN
6/3 9/3 FROM THE BEGINNING OF THIS YEAR
NBP SPOT 133.25 140.00 6.75 26 90.89 140.00 71.25
NBP APR26 137.42 143.53 6.11 29.74 81.77 143.53 64.52
NBP MAY26 134.17 141.50 7.33 32.55 79.49 141.50 63.61
NBP JUN26 127.30 135.07 7.77 31.38 77.27 135.07 62.69
NBP JUL26 121.31 129.95 8.64 30.65 75.70 129.95 62.36
NBP AUG26 120.01 128.98 8.97 31.48 75.60 128.98 62.76
NBP SEP26 121.09 129.42 8.33 32.82 76.58 129.42 64.03
NBP OCT26 119.32 127.67 8.35 34.52 75.88 127.67 63.64
NBP NOV26 121.02 129.37 8.35 34.34 79.26 129.37 67.58
NBP DEC26 123.67 131.72 8.05 35.46 81.26 131.72 69.62
NBP JAN27 121.23 130.40 9.17 33.94 82.65 130.40 71.31
NBP FEB27 118.83 128.46 9.63 34.46 82.12 128.46 71.23
NBP MAR27 109.05 118.76 9.71 31.65 77.25 118.76 67.33
NBP Q2 26 132.98 140.05 7.07 31.24 79.51 140.05 63.67
NBP Q3 26 120.80 129.45 8.65 31.64 75.96 129.45 63.04
NBP Q4 26 121.34 129.59 8.25 34.78 78.80 129.59 66.94
NBP Q1 27 116.29 125.79 9.5 33.32 80.62 125.79 69.91
NBP SUM2026 126.86 134.72 7.86 31.44 77.72 134.72 63.35
NBP WIN2026 118.84 127.71 8.87 34.05 79.70 127.71 68.41
NBP SUM2027 81.17 89.65 8.48 22.43 62.64 89.65 57.74
NBP WIN2027 79.80 86.53 6.73 16.4 68.57 86.53 65.81
NBP SUM2028 56.22 59.90 3.68 5.87 54.59 59.90 52.62
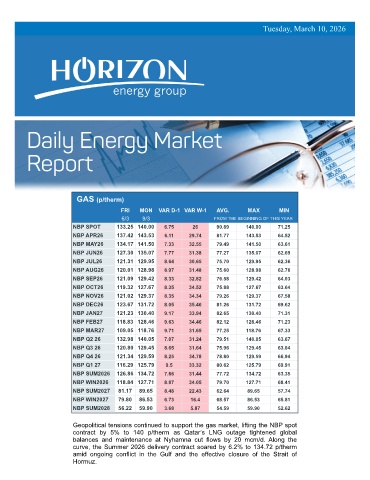
Geopolitical tensions continued to support the gas market, lifting the NBP spot
contract by 5% to 140 p/therm as Qatar’s LNG outage tightened global
balances and maintenance at Nyhamna cut flows by 20 mcm/d. Along the
curve, the Summer 2026 delivery contract soared by 6.2% to 134.72 p/therm
amid ongoing conflict in the Gulf and the effective closure of the Strait of
Hormuz.