
Page 58 - 2025 HEG Daily Energy Market Report
P. 58
Tuesday, February 24, 2026
GAS (p/therm)
FRI MON VAR D-1 VAR W-1 AVG. MAX MIN
20/2 23/2 FROM THE BEGINNING OF THIS YEAR
NBP SPOT 80.25 76.65 -3.6 2.9 86.51 105.00 71.25
NBP MAR26 77.65 77.05 -0.6 4.5 79.63 95.20 66.34
NBP APR26 76.96 76.82 -0.14 5.25 74.13 84.33 64.52
NBP MAY26 76.14 76.37 0.23 5.27 72.04 79.56 63.61
NBP JUN26 74.72 75.11 0.39 4.92 70.46 77.92 62.69
NBP JUL26 73.49 73.70 0.21 4.78 69.58 76.67 62.36
NBP AUG26 73.49 73.70 0.21 4.78 69.76 76.61 62.76
NBP SEP26 74.73 75.23 0.5 5.21 70.92 77.66 64.03
NBP OCT26 74.66 75.26 0.6 5.44 70.39 77.26 63.64
NBP NOV26 78.76 79.27 0.51 5.37 74.03 81.27 67.58
NBP DEC26 80.98 81.51 0.53 5.14 76.12 83.46 69.62
NBP JAN27 83.12 83.19 0.07 4.36 78.05 85.80 71.31
NBP FEB27 82.57 82.96 0.39 4.61 77.94 85.25 71.23
NBP Q2 26 75.94 76.10 0.16 5.15 72.21 80.26 63.67
NBP Q3 26 73.89 74.20 0.31 4.92 70.08 76.97 63.04
NBP Q4 26 78.13 78.67 0.54 5.31 73.51 80.66 66.94
NBP Q1 27 81.07 81.43 0.36 4.63 76.49 83.75 69.91
NBP SUM2026 74.91 75.15 0.24 5.04 71.14 78.21 63.35
NBP WIN2026 79.58 80.04 0.46 4.98 74.98 82.19 68.41
NBP SUM2027 61.84 63.85 2.01 2.86 60.41 64.45 57.74
NBP WIN2027 68.43 69.46 1.03 2.51 67.48 70.12 65.81
NBP SUM2028 54.16 54.75 0.59 1.68 54.56 58.00 52.62
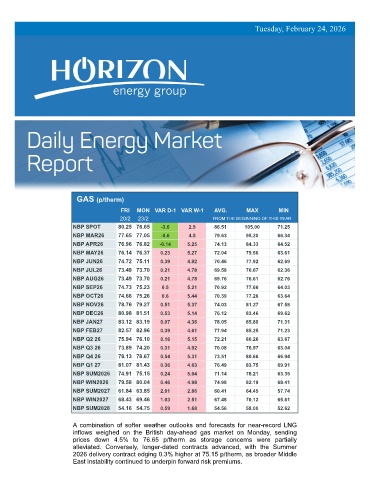
A combination of softer weather outlooks and forecasts for near-record LNG
inflows weighed on the British day-ahead gas market on Monday, sending
prices down 4.5% to 76.65 p/therm as storage concerns were partially
alleviated. Conversely, longer-dated contracts advanced, with the Summer
2026 delivery contract edging 0.3% higher at 75.15 p/therm, as broader Middle
East instability continued to underpin forward risk premiums.