
Page 122 - 2025 HEG Daily Energy Market Report
P. 122
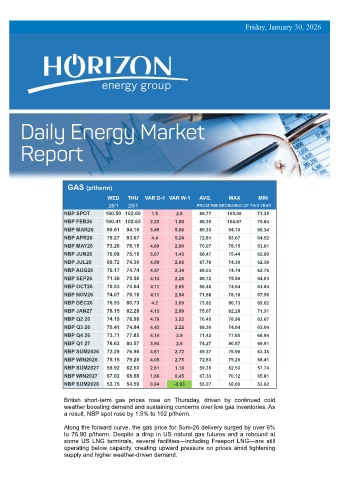
Friday, January 30, 2026


                         GAS (p/therm)

                                       WED    THU   VAR D-1 VAR W-1    AVG.      MAX        MIN
                                       28/1   29/1                    FROM THE BEGINNING OF THIS YEAR
                       NBP SPOT       100.50 102.00   1.5      2.8     88.77     105.00    73.35
                       NBP FEB26      100.41 102.63   2.22    1.88     88.30     104.67    70.84
                       NBP MAR26       90.61  94.10   3.49    5.66     80.33     94.10     66.34
                       NBP APR26       79.27  83.67   4.4     5.24     72.81     83.67     64.52
                       NBP MAY26       73.26  78.15   4.89    2.99     70.07     78.15     63.61
                       NBP JUN26       70.08  75.15   5.07    1.43     68.47     75.44     62.69
                       NBP JUL26       69.72  74.30   4.58    2.06     67.78     74.30     62.36
                       NBP AUG26       70.17  74.74   4.57    2.34     68.03     74.74     62.76
                       NBP SEP26       71.36  75.50   4.14    2.26     69.12     75.50     64.03
                       NBP OCT26       70.53  74.64   4.11    2.65     68.48     74.64     63.64
                       NBP NOV26       74.07  78.18   4.11    2.94     71.88     78.18     67.58
                       NBP DEC26       76.53  80.73   4.2     3.09     73.92     80.73     69.62
                       NBP JAN27       78.15  82.28   4.13    2.99     75.67     82.28     71.31
                       NBP Q2 26       74.19  78.98   4.79    3.22     70.45     78.98     63.67
                       NBP Q3 26       70.41  74.84   4.43    2.22     68.30     74.84     63.04
                       NBP Q4 26       73.71  77.85   4.14     2.9     71.42     77.85     66.94
                       NBP Q1 27       76.63  80.57   3.94     2.6     74.27     80.57     69.91
                       NBP SUM2026     72.29  76.90   4.61    2.72     69.37     76.90     63.35
                       NBP WIN2026     75.15  79.20   4.05    2.75     72.83     79.20     68.41
                       NBP SUM2027     59.92  62.53   2.61    1.18     59.35     62.53     57.74
                       NBP WIN2027     67.02  68.68   1.66    0.45     67.33     70.12     65.81
                       NBP SUM2028     53.75  54.59   0.84    -0.93    55.27     58.00     53.62

                       British  short-term  gas  prices  rose  on  Thursday,  driven  by  continued  cold
                       weather boosting demand and sustaining concerns over low gas inventories. As
                       a result, NBP spot rose by 1.5% to 102 p/therm.

                       Along the forward curve, the gas price for Sum-26 delivery surged by over 6%
                       to 76.90 p/therm. Despite a drop in US natural gas futures and a rebound at
                       some  US  LNG  terminals,  several  facilities—including  Freeport  LNG—are  still
                       operating below capacity, creating upward pressure on prices amid tightening
                       supply and higher weather-driven demand.