
Page 13 - Demo
P. 13
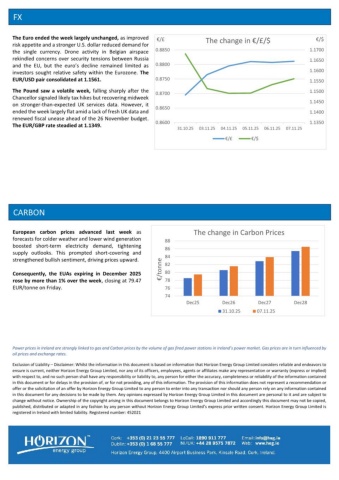
FX CARBON Power prices in Ireland are strongly linked to gas and Carbon prices by the volume of gas fired power stations in Ireland’s power market. Gas prices are in turn influenced by oil prices and exchange rates. Exclusion of Liability Disclaimer: Whilst the information in this document is based on information that Horizon Energy Group Limited considers reliable and endeavors to –ensure is current, neither Horizon Energy Group Limited, nor any of its officers, employees, agents or affiliates make any representation or warranty (express or implied) with respect to, and no such person shall have any responsibility or liability to, any person for either the accuracy, completeness or reliability of the information contained in this document or for delays in the provision of, or for not providing, any of this information. The provision of this information does not represent a recommendation or offer or the solicitation of an offer by Horizon Energy Group Limited to any person to enter into any transaction nor should any person rely on any information contained in this document for any decisions to be made by them. Any opinions expressed by Horizon Energy Group Limited in this document are personal to it and are subject to change without notice. Ownership of the copyright arising in this document belongs to Horizon Energy Group Limited and accordingly this document may not be copied, published, distributed or adapted in any fashion by any person without Horizon Energy Group Limited’s express prior written consent. Horizon Energy Group Limited is registered in Ireland with limited liability. Registered number: 452021 European carbon prices surged week-on-week, supported by stronger policy backing, improved macro sentiment, and higher demand driven by colder weather and fuel switching from gas to coal. The rally was reinforced by positive EU signals, while temporary concerns over policy measures and weaker positioning had only a limited effect. As a result, EUAs for Dec-26 and Dec-27 jumped by 6% to 71.67 EUR/t and 74.33 EUR/t, respectively. 606570758085Dec26Dec27Dec28Dec29€/tonneThe change in Carbon Prices20.03.2627.03.261.14601.14801.15001.15201.15401.15601.15801.16001.16200.86200.86300.86400.86500.86600.86700.868020.03.2623.03.2624.03.2625.03.2626.03.2627.03.26€/$€/£The change in €/£/$ €/£€/$The Euro slipped against the U.S. dollar last week, as hopes for a swift end to the war in Iran faded and continued to weigh on the single European currency. Donald Trump briefly renewed some optimism on Thursday by extending the deadline for strikes on Iranian energy facilities to April, but this was short-lived after reports of a possible deployment of an additional 10,000 troops, which could prolong the conflict and the closure of the Strait of Hormuz. On the greenback front, safe-haven demand has strengthened as markets became more defensive amid concerns over inflation and global growth. The EUR/USD pair fell by 0.3% to 1.1517 on Friday. Sterling lost ground versus the European single currency after the latest retail sales figures showed a month-on-month decline in consumer spending. Tuesday’s PMI data indicated a notable slowdown in private-sector output, with the Middle East conflict beginning to visibly weigh on economic activity. As such, the EUR/GBP rate rose by 0.3% to 0.8672.
