
Page 74 - 2025 HEG Daily Energy Market Report
P. 74
Wednesday, February 18, 2026
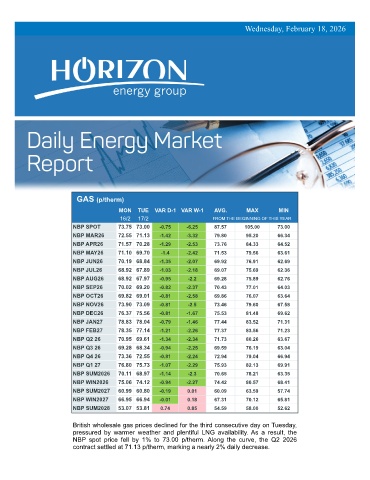
GAS (p/therm)
MON TUE VAR D-1 VAR W-1 AVG. MAX MIN
16/2 17/2 FROM THE BEGINNING OF THIS YEAR
NBP SPOT 73.75 73.00 -0.75 -6.25 87.57 105.00 73.00
NBP MAR26 72.55 71.13 -1.42 -3.32 79.80 95.20 66.34
NBP APR26 71.57 70.28 -1.29 -2.53 73.76 84.33 64.52
NBP MAY26 71.10 69.70 -1.4 -2.42 71.53 79.56 63.61
NBP JUN26 70.19 68.84 -1.35 -2.07 69.92 76.91 62.69
NBP JUL26 68.92 67.89 -1.03 -2.18 69.07 75.69 62.36
NBP AUG26 68.92 67.97 -0.95 -2.2 69.28 75.89 62.76
NBP SEP26 70.02 69.20 -0.82 -2.37 70.43 77.01 64.03
NBP OCT26 69.82 69.01 -0.81 -2.58 69.86 76.07 63.64
NBP NOV26 73.90 73.09 -0.81 -2.5 73.46 79.60 67.58
NBP DEC26 76.37 75.56 -0.81 -1.67 75.53 81.48 69.62
NBP JAN27 78.83 78.04 -0.79 -1.46 77.44 83.52 71.31
NBP FEB27 78.35 77.14 -1.21 -2.26 77.37 83.56 71.23
NBP Q2 26 70.95 69.61 -1.34 -2.34 71.73 80.26 63.67
NBP Q3 26 69.28 68.34 -0.94 -2.25 69.59 76.19 63.04
NBP Q4 26 73.36 72.55 -0.81 -2.24 72.94 79.04 66.94
NBP Q1 27 76.80 75.73 -1.07 -2.29 75.93 82.13 69.91
NBP SUM2026 70.11 68.97 -1.14 -2.3 70.65 78.21 63.35
NBP WIN2026 75.06 74.12 -0.94 -2.27 74.42 80.57 68.41
NBP SUM2027 60.99 60.80 -0.19 0.01 60.09 63.59 57.74
NBP WIN2027 66.95 66.94 -0.01 0.18 67.31 70.12 65.81
NBP SUM2028 53.07 53.81 0.74 0.85 54.59 58.00 52.62
British wholesale gas prices declined for the third consecutive day on Tuesday,
pressured by warmer weather and plentiful LNG availability. As a result, the
NBP spot price fell by 1% to 73.00 p/therm. Along the curve, the Q2 2026
contract settled at 71.13 p/therm, marking a nearly 2% daily decrease.